
- Define each measure before choosing its visual.
- Agree an authoritative source and owner for every KPI.
- Make refresh timing, access and validation explicit.
1. Find the reason behind the disagreement
Sales reports one revenue figure. Finance reports another. Operations has a third view of what has shipped. The difference may not be a calculation error: each team may be measuring a different event, at a different time, under a different rule.
Before building another dashboard, choose a few disputed measures and trace them back to the source. Is revenue based on orders, shipments or posted invoices? Are returns included? Which currency and exchange-rate rule apply? A reporting project should make these decisions visible rather than hide them behind a chart.
2. Create a short business definition for each KPI
For every priority measure, record its purpose, calculation, source, exclusions, reporting period and owner. Describe the definition in language the people using the report understand. A technical expression is useful for implementation, but it does not replace business agreement.
For example, an inventory measure needs a clear position on goods in transit, blocked stock and consignment stock where relevant. If departments need different views, label them explicitly. Consistency does not require pretending that every business question has the same answer.
3. Decide which source is authoritative
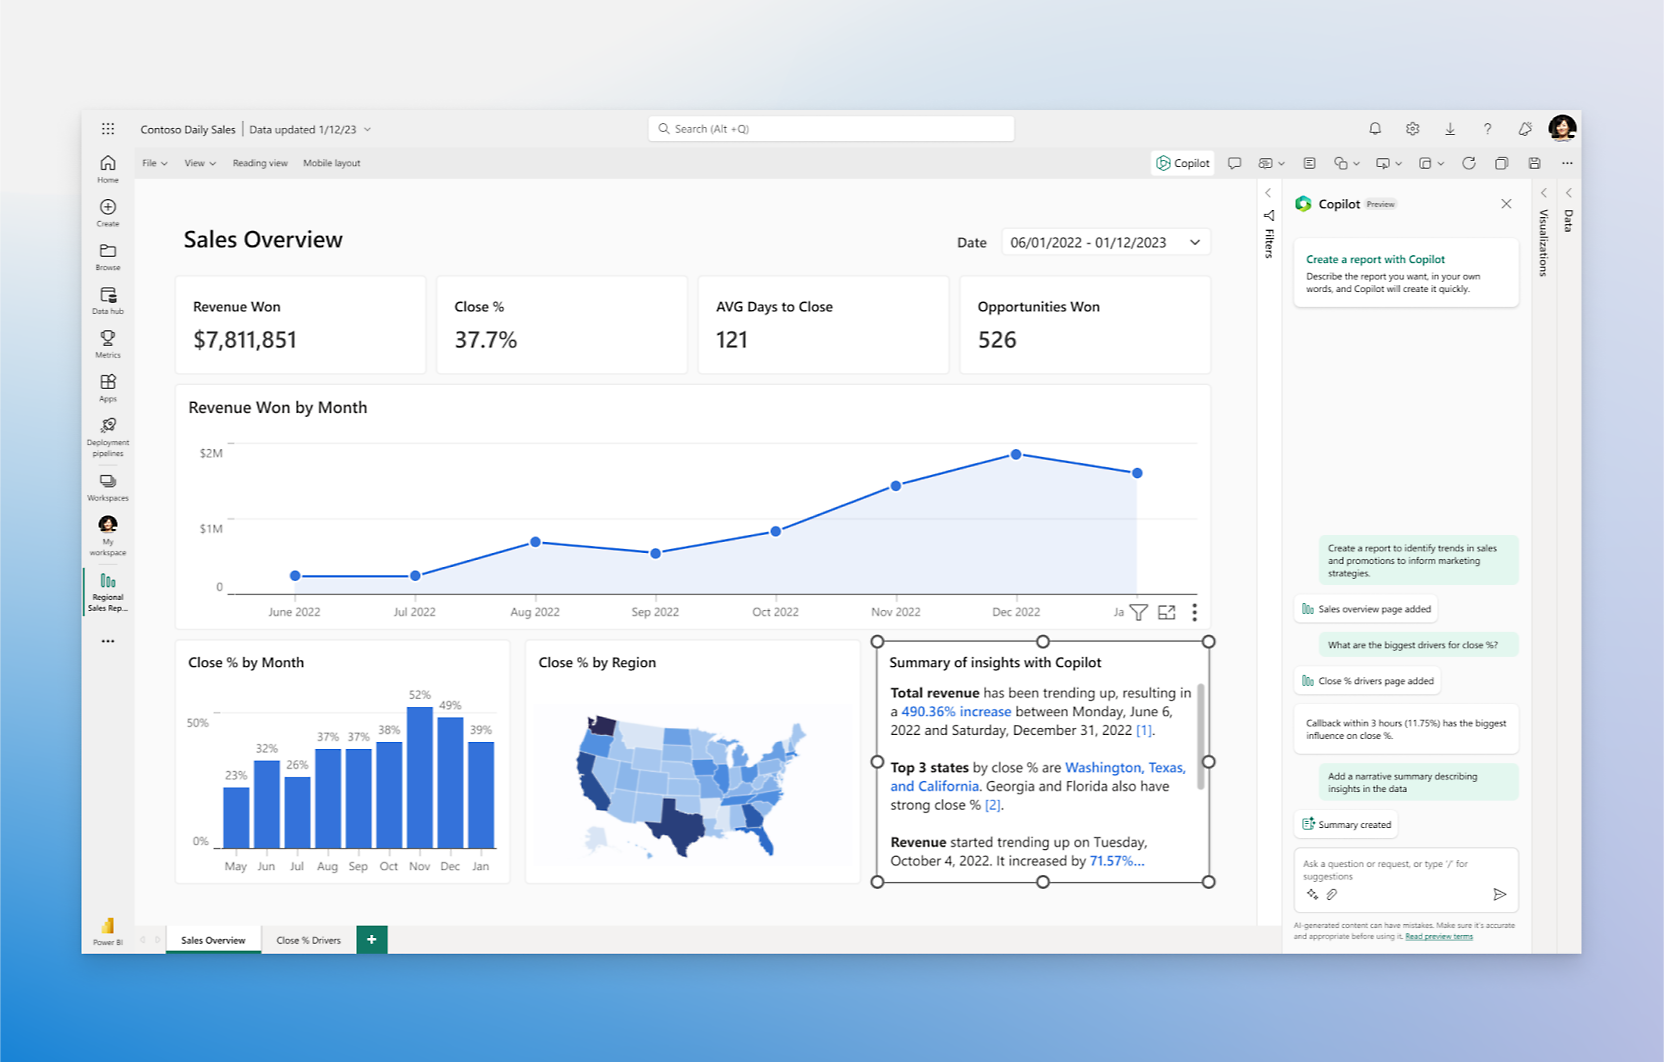
Power BI connects and visualizes data for business intelligence, as described in Microsoft’s Power BI overview. Reliable reporting still depends on the quality and meaning of the underlying records.
Document where each measure originates and how information travels into the report. When a spreadsheet adds a manual adjustment, identify who owns it and why it is needed. Agree how corrections reach the source and how downstream reports are checked after a change.
4. Set expectations for timing and access
A report refreshed overnight should not be compared with a live transaction list without considering timing. Display the relevant reporting period and communicate the refresh expectation. If a refresh fails, the audience needs to understand whether the figures are still suitable for the decision they are making.
Define access by business need. A manager may require detailed results for one entity and only consolidated information for another. Include access checks in testing, and review the arrangement when responsibilities change. Confirm the appropriate sharing and licensing model for your intended audience.
5. Validate before the dashboard becomes a management habit
Reconcile a sample period against agreed source records. Check normal transactions and exceptions, including returns, cancellations and late postings where relevant. Ask the business owner to approve the meaning of a measure as well as its total.
Once published, maintain a route for questions and changes. A new product category, revised costing rule or changed source field can affect an established report. Assign responsibility for reviewing those changes and communicating their impact to users.
Bring these questions to your next reporting review
- Which decision should this report support?
- Does every audience understand each KPI the same way?
- Which source, time period and exclusions apply?
- Who validates the result and owns corrections?
- How will users know that the data is current?
- What access should each role have?
Tripearltech helps organizations plan Power BI reporting around finance, sales, inventory and operational needs. Agreeing the definitions early gives the technical work a clearer purpose and the business a stronger basis for trusting the result.